The Sharp Colour Science Tool
Whilst working at Sharp, I developed what came to be called the ‘Sharp Colour Science Tool’. It was developed out of a need to unify the features of other colour science tools, which existed as a mixture of barely-documented excel spreadsheets, proprietary tools from other companies and specifications with no tools attached. It was written in Python 2.7, and used the excellent ‘Colour’ library for python as a Base. However, it also deviated from Colour quite a bit.
Most LED companies have tools that analyze optical data from their LEDs. The general idea is to begin with a spectral power distribution (SPD) and convert that data into a variety of metrics, like co-ordinates on a colour space (X, Y, Z and x, y, z for the spaces we were using), distance from the planckian locus (called Duv), luminous flux, CCT (co-ordinated colour temperature), and CRI (colour rendering index – a measure of colour quality). Later, the tool was also expanded to include the metrics from the new IES-TM30.
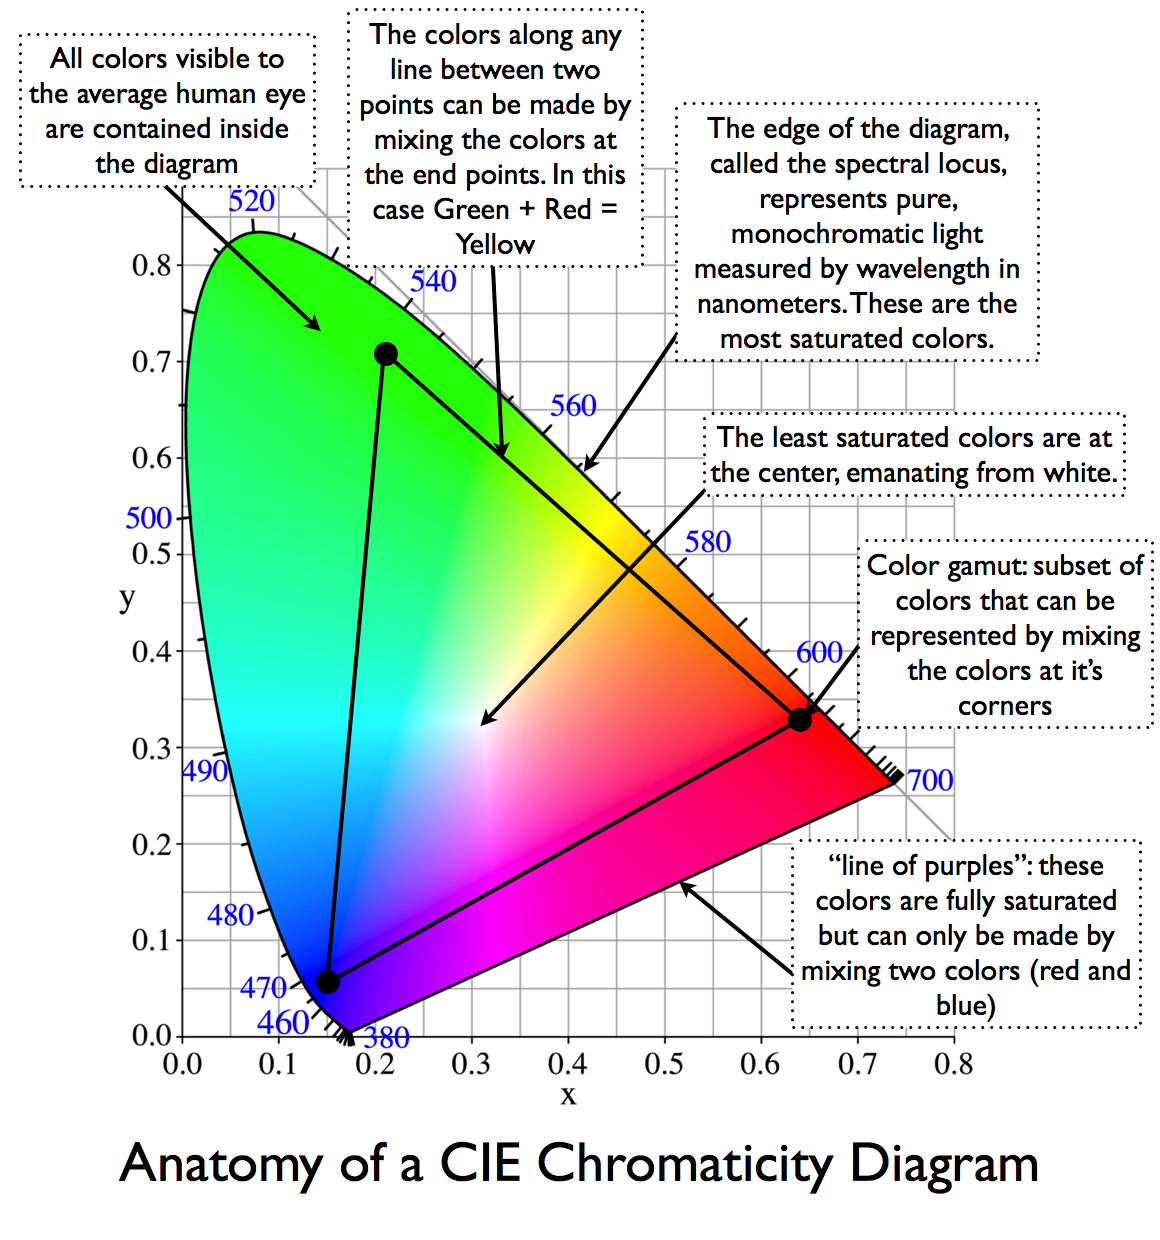
Some of these are directly related to the physical properties of the light. For example, x, y, u and v are able to represent the colour of the light, and place it at a particular point inside a chromacity diagram.
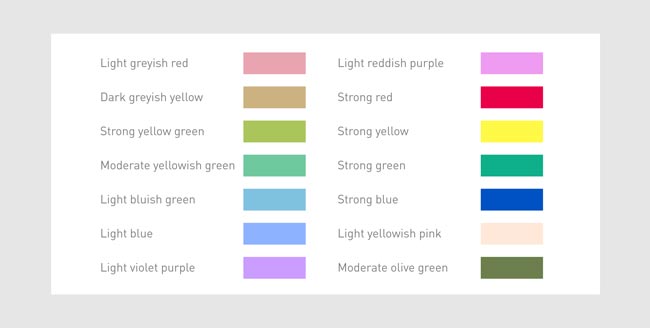
However, some are related more to the subjective quality of the light or its ability to render a particular set of hues. For example, CRI (colour rendering index) measures the ability of the light to accurately render a selection of 14 different ’common’ colours. CQS does the same for a different set of colours, whereas GAI measures the area of the gamut of colours (represented by a polygon on the chromaticity diagram).
These two metrics represent two different approaches to lighting design – to some, accurate reproduction of colour is the most important thing, but others desire everything they illuminate to look vivid and colourful. An interesting aside: the desirability of different types of light, combined with the subjectivity of light quality presents an interesting challenge to lighting designers. One way in which Sharp responded to this was producing a range of LED lights with spectra tailor-made for different situations. Take, for example, the GW7MREBRGZC, an LED designed specifically to illuminate bread.
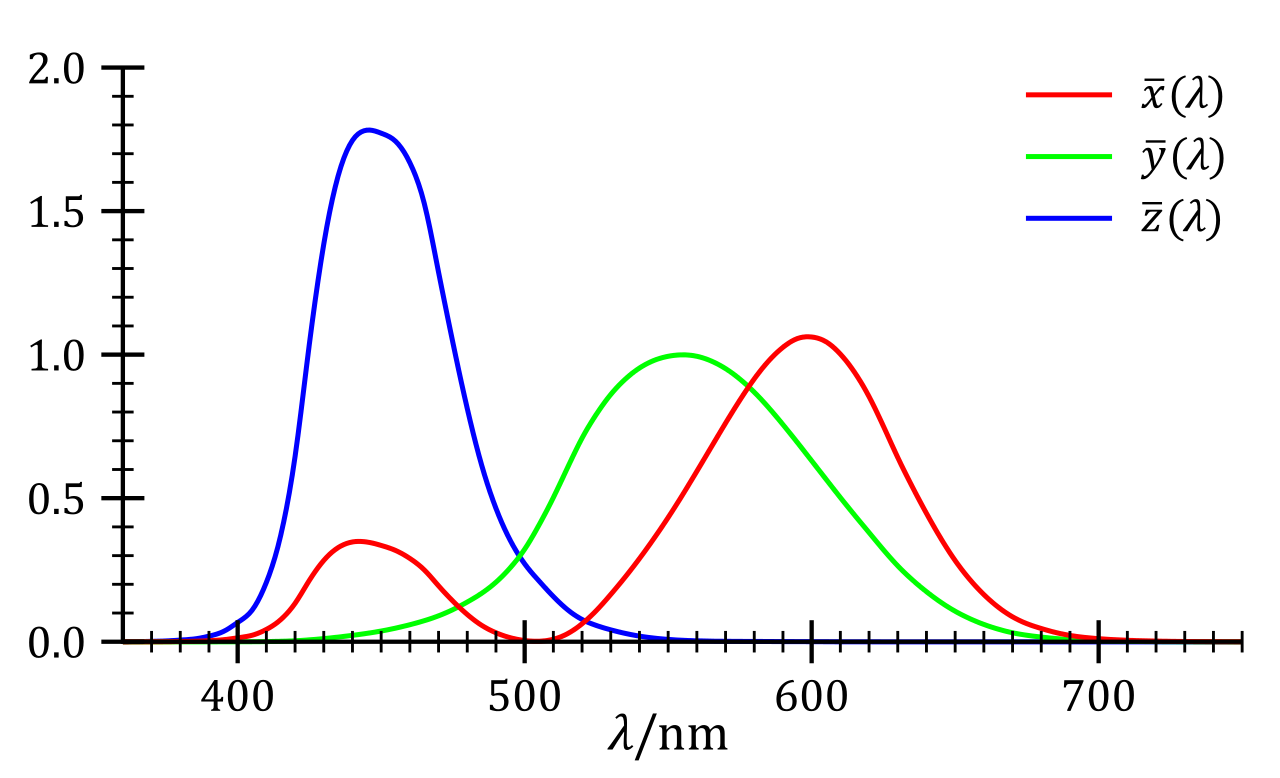
It seems obvious now, but I had not considered that calculations in colour science always take the sensitivity of the human eye to different hues into account. There are, in fact, ’colour-matching functions’ that describe which wavelengths the human eye is most sensitive to.
Calculations in colour science are based on ’colour spaces’ which correspond to these colour matching functions. Different colour spaces have different use cases, but the main one used in the LED industry is the (rather outdated) CIE 1931 colour space.
Most lighting companies roll their own internal set of tools. Different companies will be focusing on different metrics, or chasing different specifications, so each one will end up being different. It’s an interesting time to be developing a tool like this, as the market is currently undergoing a shift that takes it from the aging CRI (disliked for its bias toward puke-green), to the newer, slicker metrics like CQS, GAI and the IES-TM30.
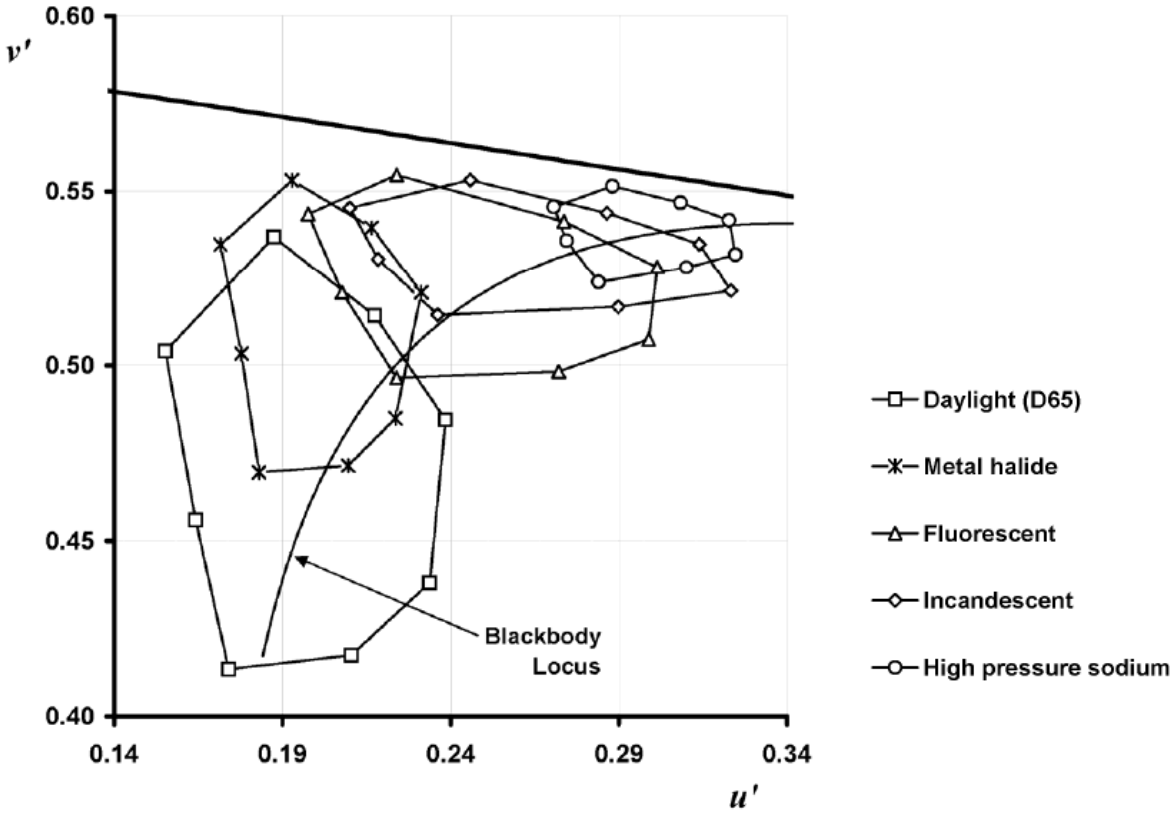
Gamut areas of common light sources. A larger gamut will be reflected in a higher Gamut Area Index.
Over the course of a few weeks, I built a colour tool tailor-made to Sharp’s needs, using Python 2.7 and the aforementioned Colour library. Among the library’s most useful features were data structures for colour metrics (such as an automatically-interpolated SPD) and special plotting tools with pre-made high-resolution CIE diagrams. With the Colour library as a base, I implemented a variety of new features, as well as tweaks and optimisations to current ones.
Along the way, I also re-implemented many core library functions using different approximations. The Colour library was not designed specifically for LED testing, and made use of a number of approximations that are uncommon in that industry. For example: a prominent metric for the colour of LED lights is the ‘colour temperature’. The idea is that a blackbody at 3000K, according to Planck’s formula, emits a red-tinged spectrum, whereas one at 6000K will emit a blue-tinged one instead. The problem is that ‘colour temperature’ is only a valid metric for spectra that a blackbody can emit, and most LED lights are only blackbodies in an approximate sense. I compared the results generated by several different methods to those found in competitor tools, and ended up implementing highly accurate method for computing the colour temperature developed by Yohsi Ohno at the NIST. Although the different approximations rarely differ by more than a few Kelvin, this means that data generated by my tool can be compared like-for-like with data from other LED companies.
Finally, I developed a method of computing the metrics found in the IES-TM30. The TM-30 differs from other metrics in that it separates the accuracy of colour rendering and the gamut (the range of colours that can be represented) into two separate metrics, Rf and Rg respectively. I was able to acquire a pre-release version of IES’s tool, written in Microsoft Excel and VBA, break the copy protection on the Excel document, read their source code and reverse-engineer their tool in order to implement IES-TM30 computations and plots in the Sharp Colour Science Tool before they were available in any other tool.
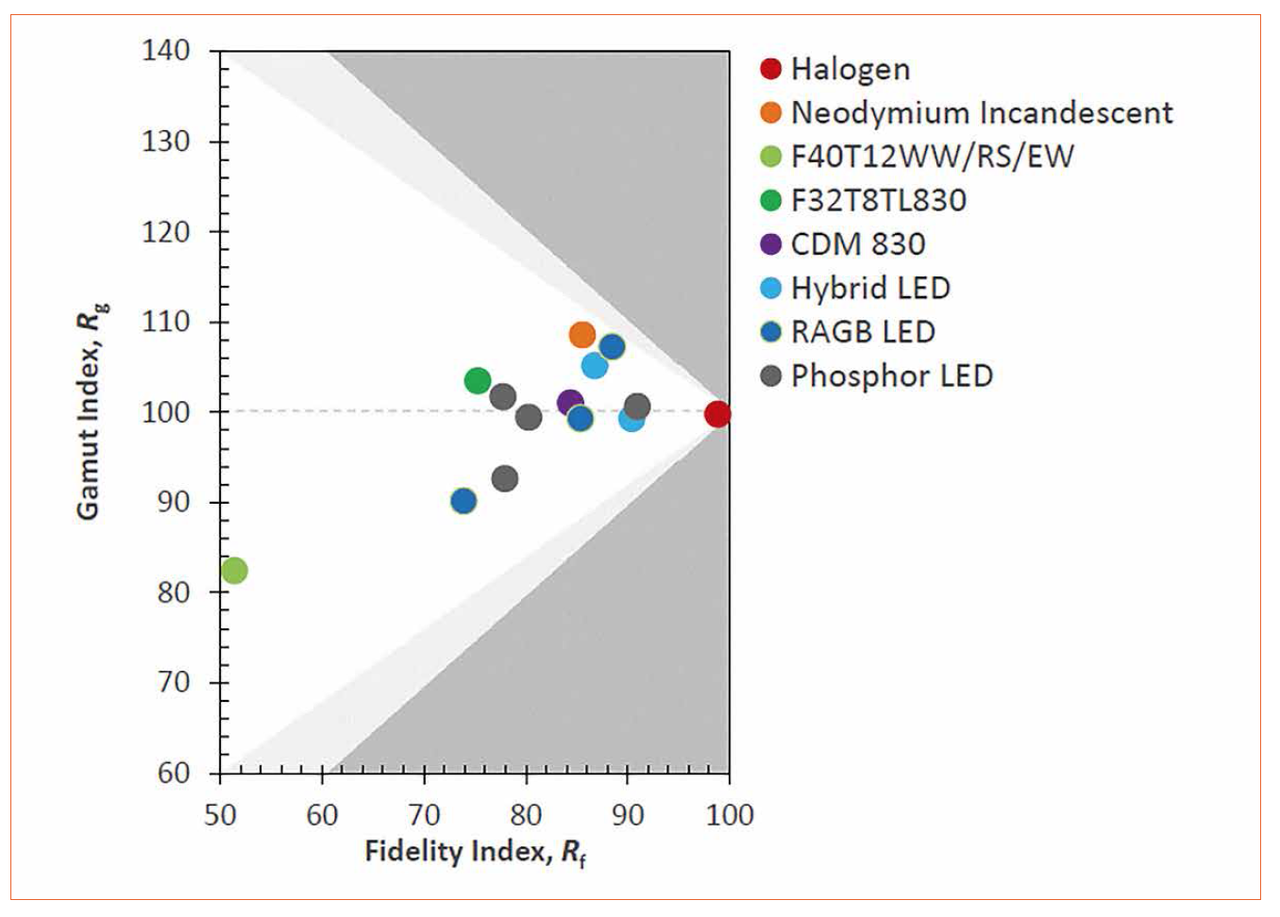
IES-TM30 scores for various LEDs. An increase in chroma above the original level of the sample always means a reduction in the accuracy of the lighting device, hence the grey ‘impossible zone’.
Initially, I did not design a GUI for the tool, believing that most engineers would probably be fine with using a CLI version. This somewhat naive preconception slowly vanished, as the input that could be provided to the program became increasingly complex. After examining the PyQt and Tkinter frameworks, I settled on Enaml, a ‘superset of Python’ (as the developers very proudly call it), which focuses on representing GUI elements in an extremely structured, hierarchical manner, similar to QML for Qt or WPF for Windows.
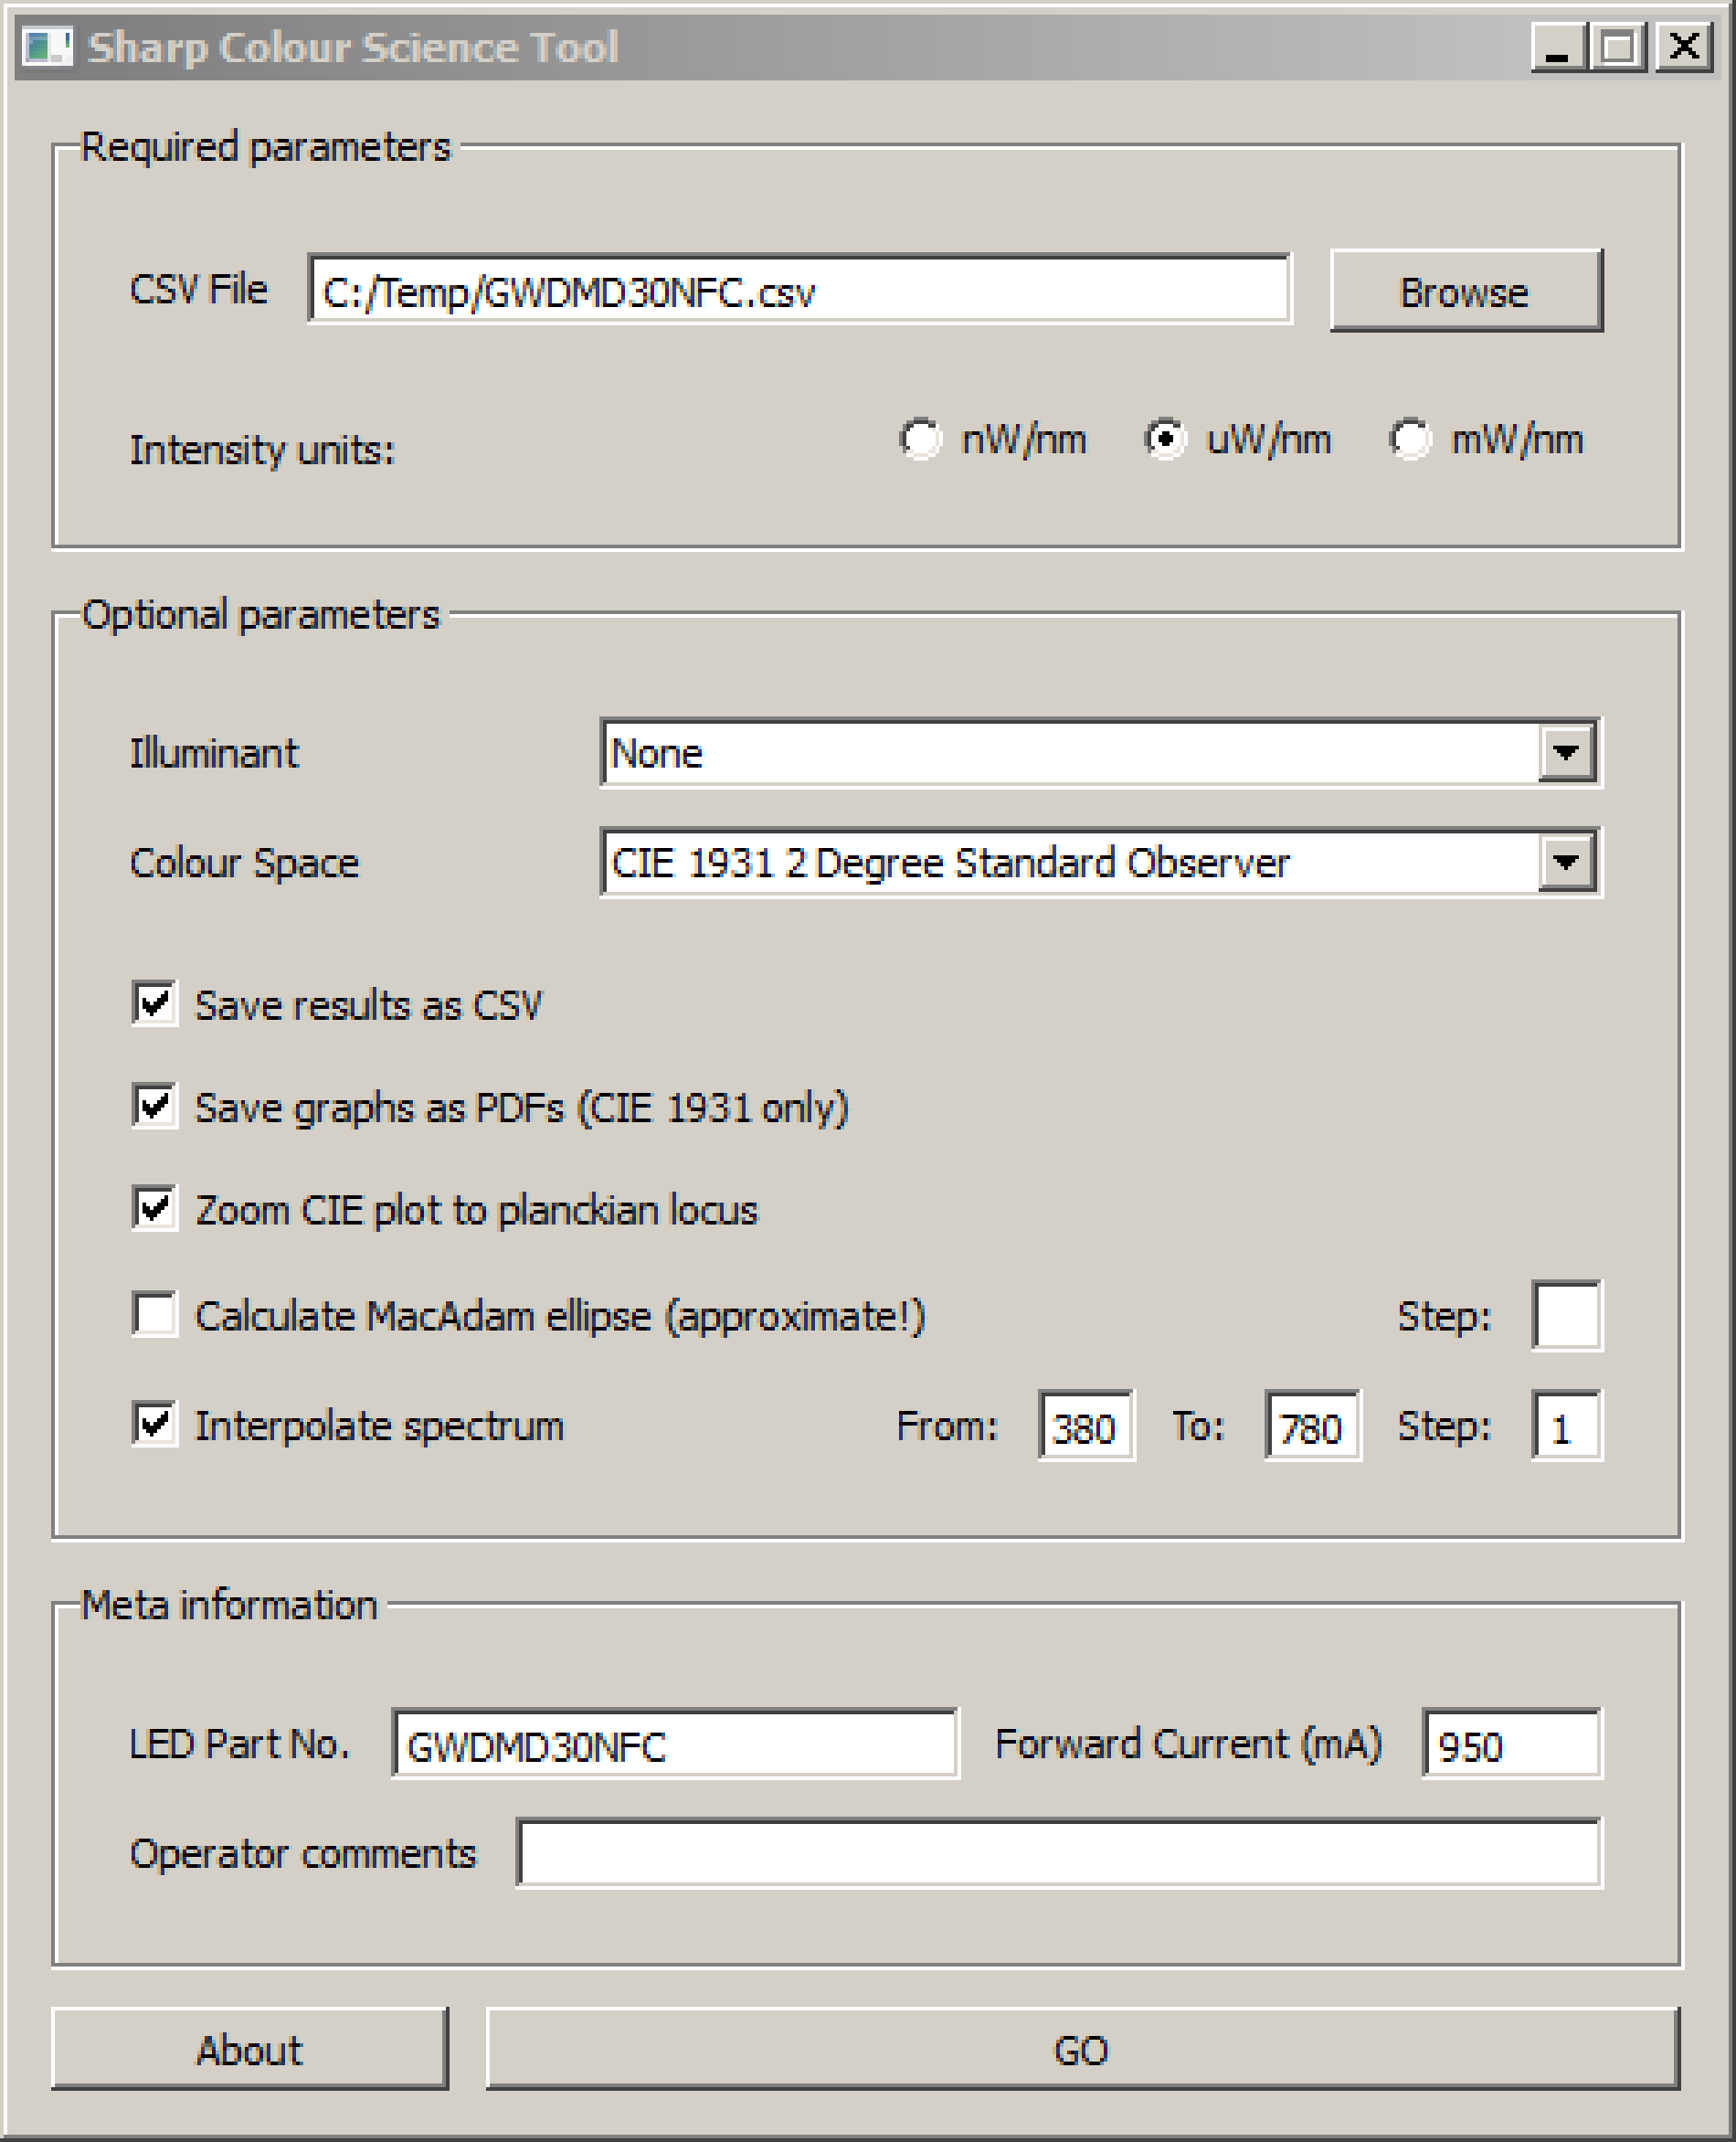
Sharp Colour Science Tool 4.0 GUI. There were actually a few versions after this!
The colour tool is something that I found useful in my day-to-day work! It has the functionality to convert raw spectral data from an integrating sphere into an easy-to-read one-page PDF report, complete with bleeding-edge metrics and standards for colour quality. It can also be used in the same way for competitor data, and this data can come from anywhere – be that from a finely-calibrated integrating sphere, a spectrometer for a phone or a digitized PDF. It can automatically load data from a variety of formats and it can rescale, interpolate and standardize the formatting of large amounts of spectral data at once. It will even automatically validate its input based on the part number of the LED and inform the user if there is a mismatch. And it’s already being used for processing all of the Sharp European Development Center’s spectral data, and now provides the de facto export format for sending this data to customers.
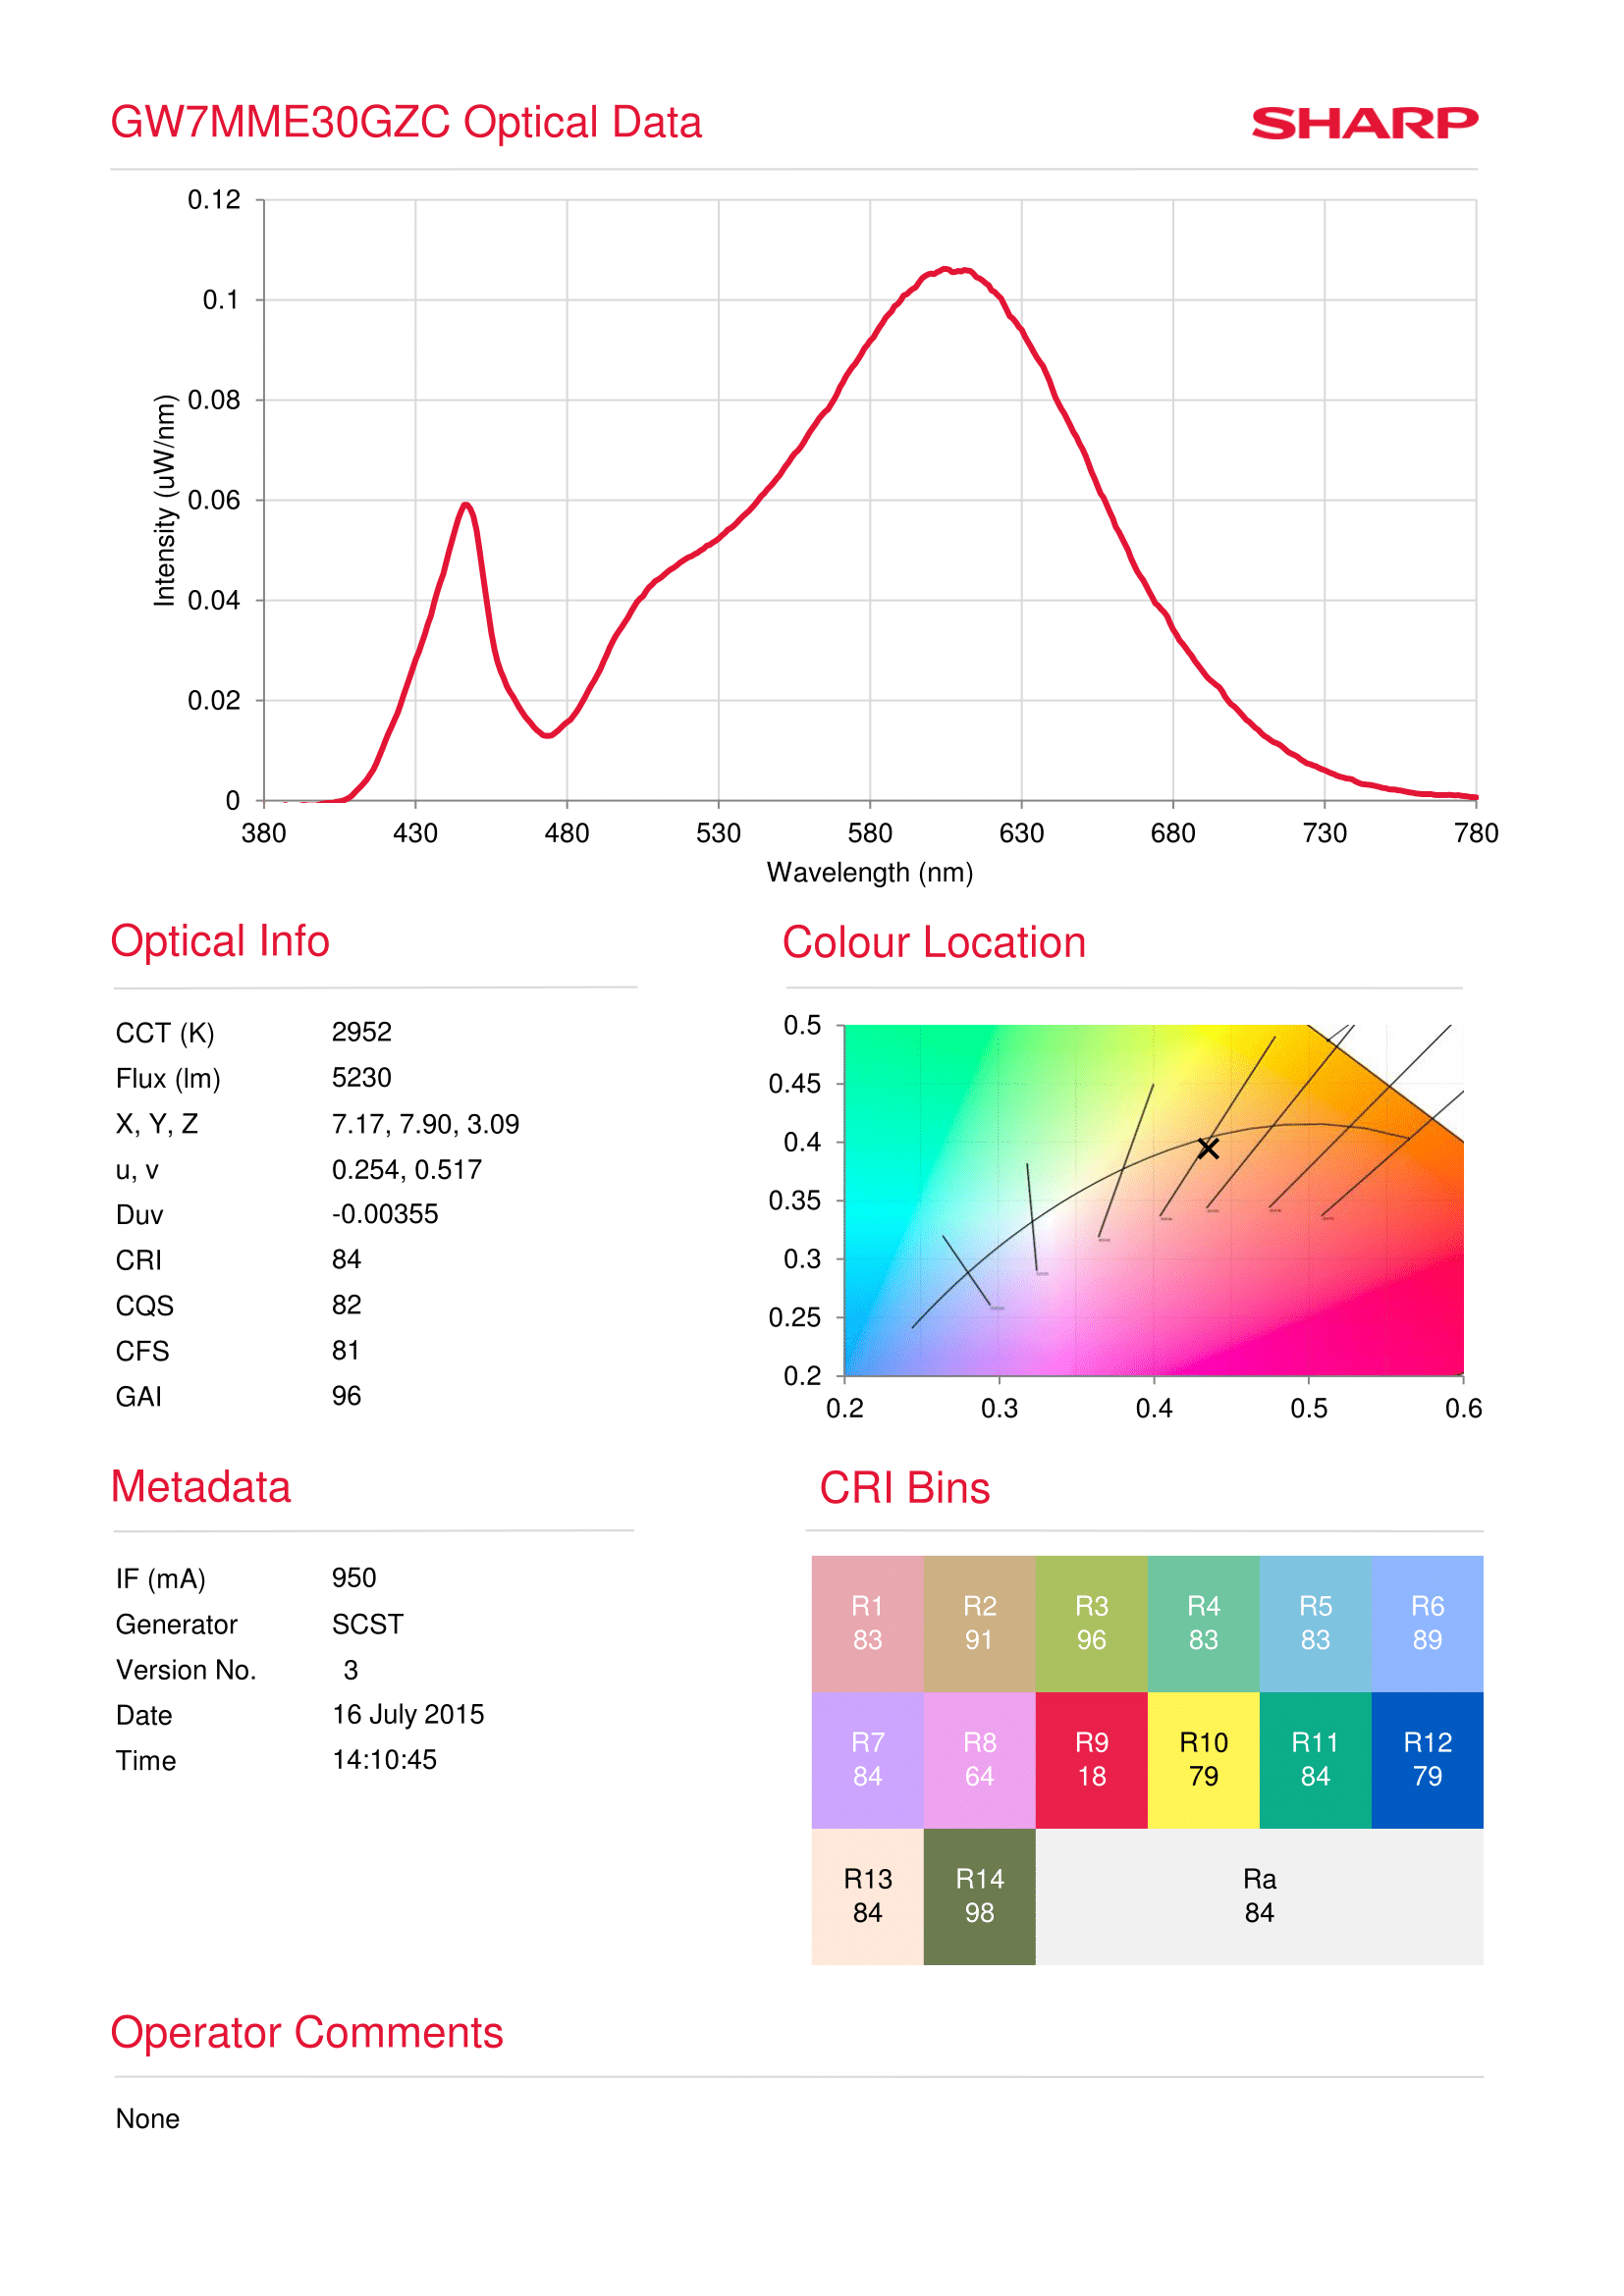
Sample colour tool report in CRI mode. The tool can also output in ‘TM-30 mode’ with special TM-30-specific plots, and ‘batch analysis mode’, which allows the data for multiple LEDs to be displayed on one page.
Last updated December 18, 2016.