The Physics and Thermal Characterisation of Sharp LEDs
The invention of the first LED is mostly attributed to the soviet inventor Oleg Vladimirovich Losev, in 1928. His discovery of the non-thermal emission of light by silicon carbide diodes was ignored by his contemporaries, and was almost lost to history. Losev himself was killed in the siege on Leningrad during the Second World War.
The LED, however, was revived in the 1950s, and has flourished in recent decades. Losev himself was not so lucky. Over time, the technology was rediscovered and revitalized, and has been slowly but surely revolutionizing lighting devices for more than half a century.
An LED is essentially just a semiconductor that doped to form a p-n junction. The band structure of the material is such that the band gap is direct and has an associated energy level transition that is approximately that of a blue photon. When a current is supplied to the junction, electrons from the conduction band drop down into the valence band, and recombine with holes, emitting their excess energy as photons, in a process known as radiative recombination.
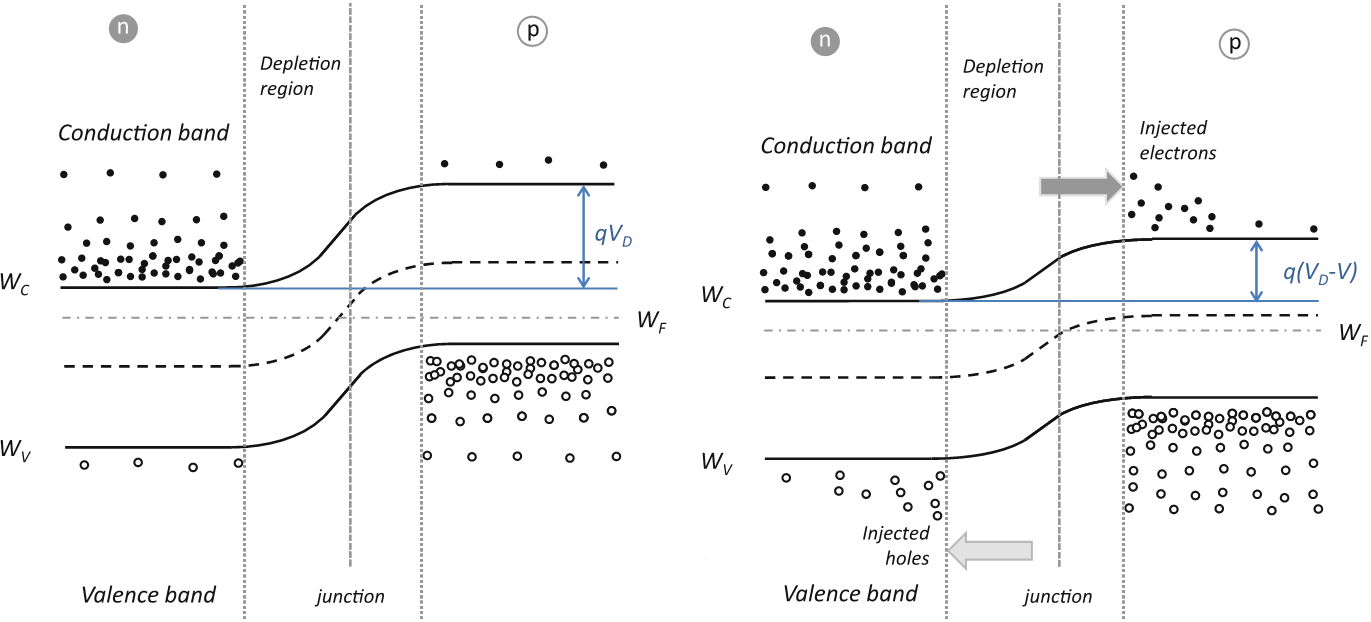
Band diagrams of an LED p-n junction. Left: junction with no current flow, Right: junction with current flow.
A major breakthrough in this field came in 1995, when Shuji Nakamura of Nichia Corporation developed an indium gallium nitride (InGaN) LED chip that emitted a brilliant blue light. The chip quickly became standard in consumer LED products. When paired with a phosphor (cerium III-doped yttrium aluminium garnet, or Ce:YAG), which absorbs some of the blue photons and emits yellow ones, a good LED device can emit a brilliant, high-quality white light that puts those dreadful fluorescent bulbs to shame.
Characterisation
Every LED has metrics associated with it that describe its efficiency, the quality of the light it produces, the type of light it produces, the maximum heat it can withstand, etc. These metrics are used internally by engineers, by marketing people, and (most importantly) by Sharp customers. Understanding an LED and being able to give good data supporting it means that Sharp’s customers will be able to design better fixtures for Sharp LEDs.
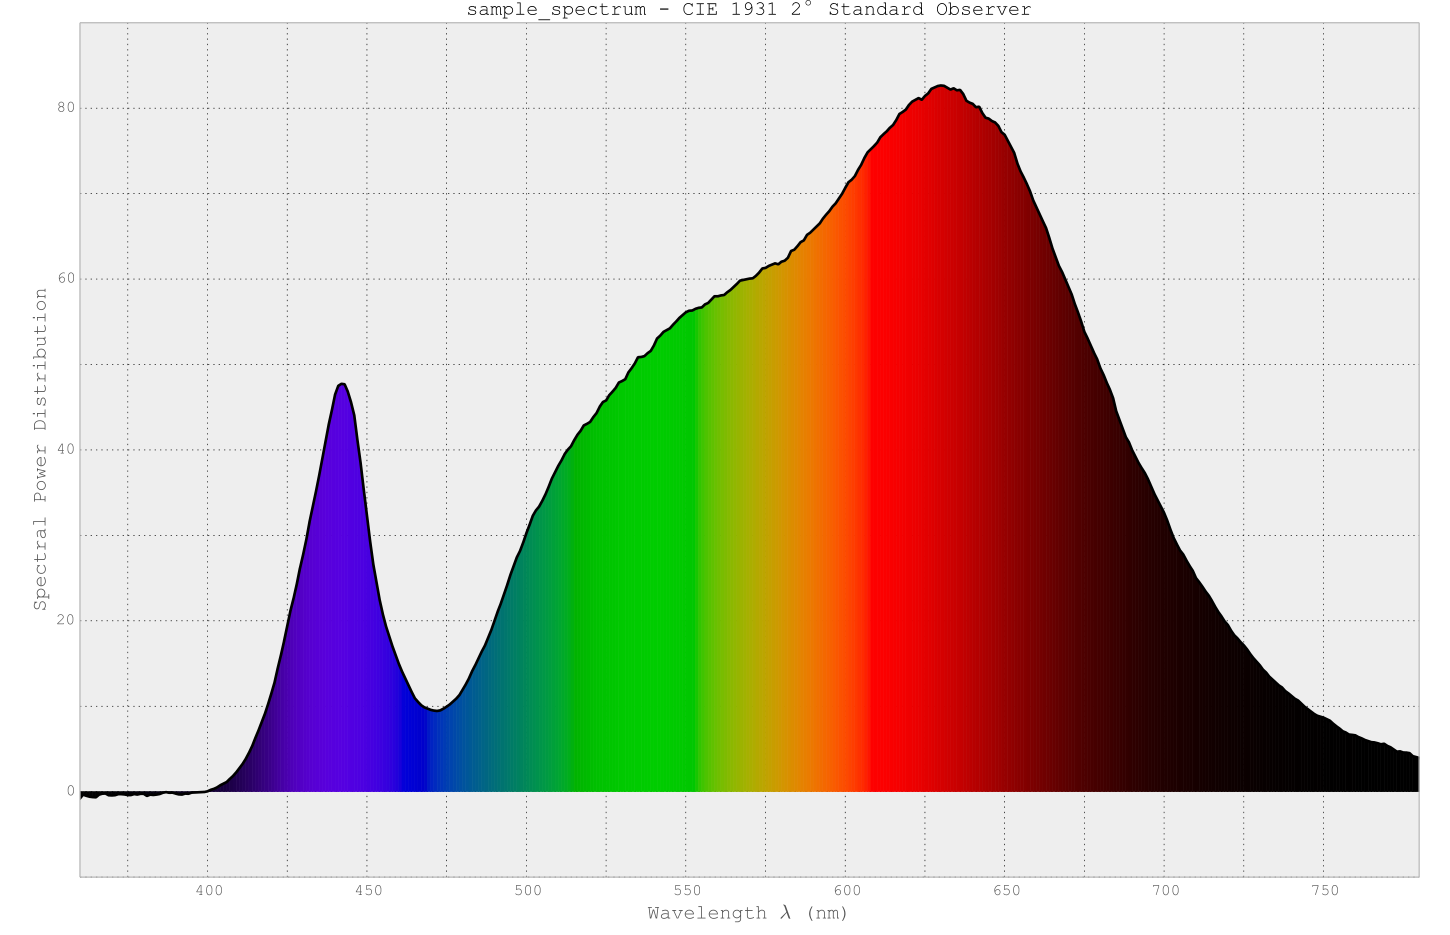
Spectral power distribution for a sample LED. Generated by my LED colour science tool.
The problem is that even the most inconspicuous metrics can be extremely difficult to obtain. A task as simple as using a thermocouple to measure a particular point, or measuring a voltage at a certain instant in time, can require months of preparation and tens of thousands of pounds worth of apparatus.
Sharp’s testing methods are both thermal and optical – that is, we measure both the quality of the light coming out of the LED, and its thermal performance, and we often measure how the two are related, as well.
We use a variety of temperature-sensing devices to test the temperature of an LED module under varying drive conditions. Obtaining the more difficult temperature measurements is important, as most luminaire manufacturers will only have access to a limited range of measurement apparatus, and need to extrapolate the data for the more difficult measurement points from what they can measure. Often, Sharp will need to supply certain kinds of thermal data, or to follow a particular measurement procedure in order to comply with an established standard. In a word, characterisation can be pernickety.
In a nutshell, this was my main role at Sharp: to thermally and optically characterise LEDs, to help develop and improve our internal test methods, and to investigate how different factors in the design or construction of light fixtures can affect an LED’s performance.
Thermal Testing
Most LEDs today are distributed in the ‘chip-on-board’ (COB) form, which was invented by Sharp. A typical COB LED is comprised of a layer of LED chips mounted directly to a substrate. Above the LED chips, there is a layer of phosphor and silicone resin.
My predecessor was in the process of designing a setup to measure T_j, the temperature of the semiconductor junction, using a method compliant with a standard authored by JEDEC. The standard can be understood like this: While the forward current being supplied is very low, the heating of the junction is negligible. As the temperature of the LED is increased, the P.D. across the LED will reduce, as the resistance of the LED device will increase. So the P.D. will drop. At low temperatures, the P.D. across the LED device and the temperature of the semiconductor junction (T_j) are linearly related by a constant called a k-factor (k = dT/dV).
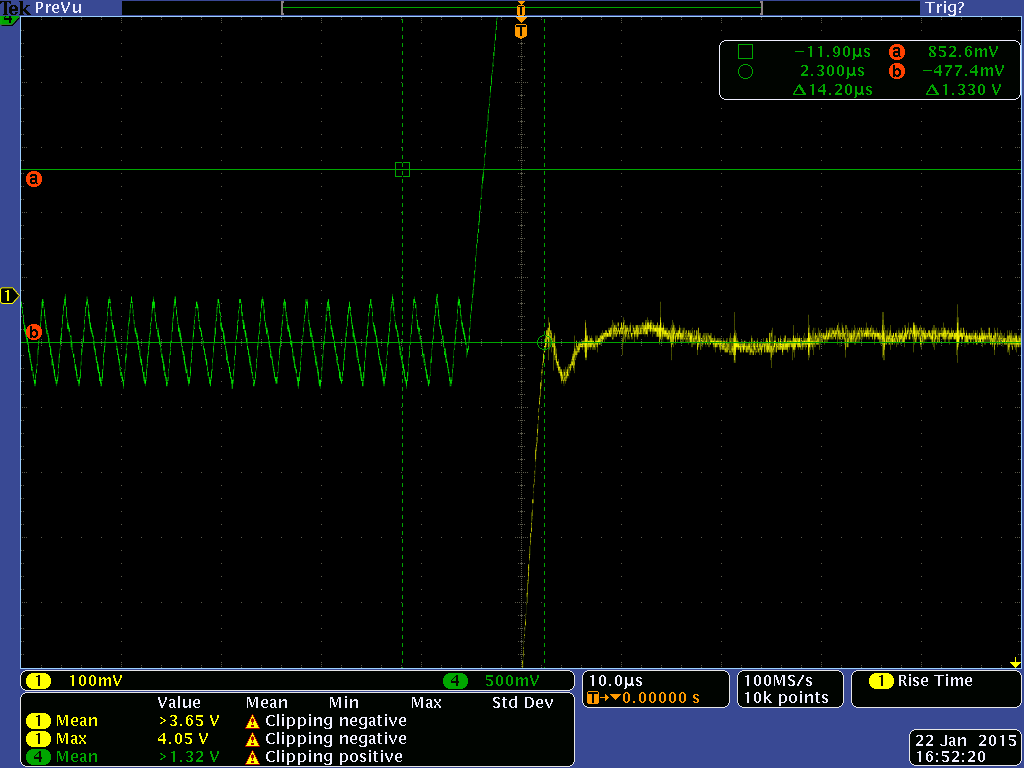
Sample oscilloscope trace. Yellow: circuit P.D. (excluding the LED itself) when LED is turned off.
You can perform a calibration to acquire this value, and then you can tell what the junction temperature is from the P.D., as long as the current is low. So, (and this is the clever bit) you run your LED normally, wait for thermal equilibrium, and then suddenly (and very quickly) remove the current. Before the LED has a chance to cool down, you measure the P.D. across it, and use the k-factor calibration from earlier to calculate the junction temperature.
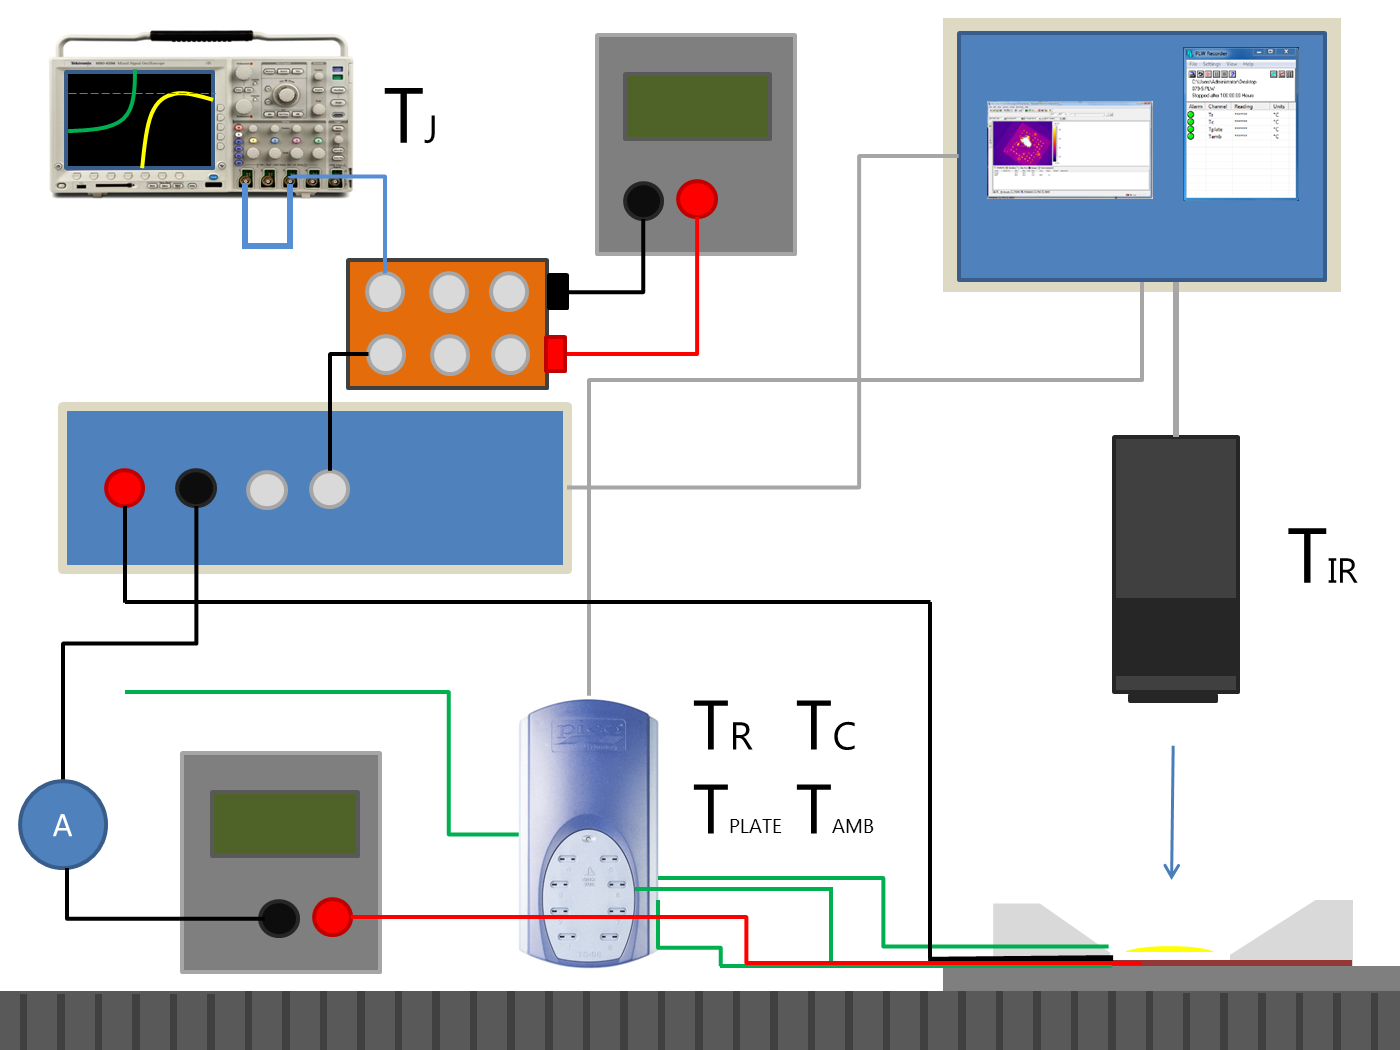
Experiment design
Here’s how it went down: an LED module is mounted to an LED module adapter plate made from aluminium. This adapter plate provides a ‘mock heatsink’ for the LED. This adapter plate was then mounted to a powerful Thermoelectric cooler (TEC), which can provide a variable amount of cooling power, simulating heatsinks of different sizes. The adapter plate is used instead of mounting to the TEC directly, as some kind of thermal interface material is required, and you can’t apply that directly to the TEC surface.
The power to the LED was supplied with a conventional power supply, but a conventional power supply cannot switch the current from high to low fast enough to comply with the JEDEC standard (the switch has to take less than 20 microseconds). I worked with one of Sharp’s in-house electronic engineers, who designed a device specifically for this purpose, imaginatively called the Fast LED switching box (FLED box, for short). The circuit design is comprised of a two part op amp array and a DAC. The FLED box uses an Arduino Mini Pro, and is controlled by a computer via USB.
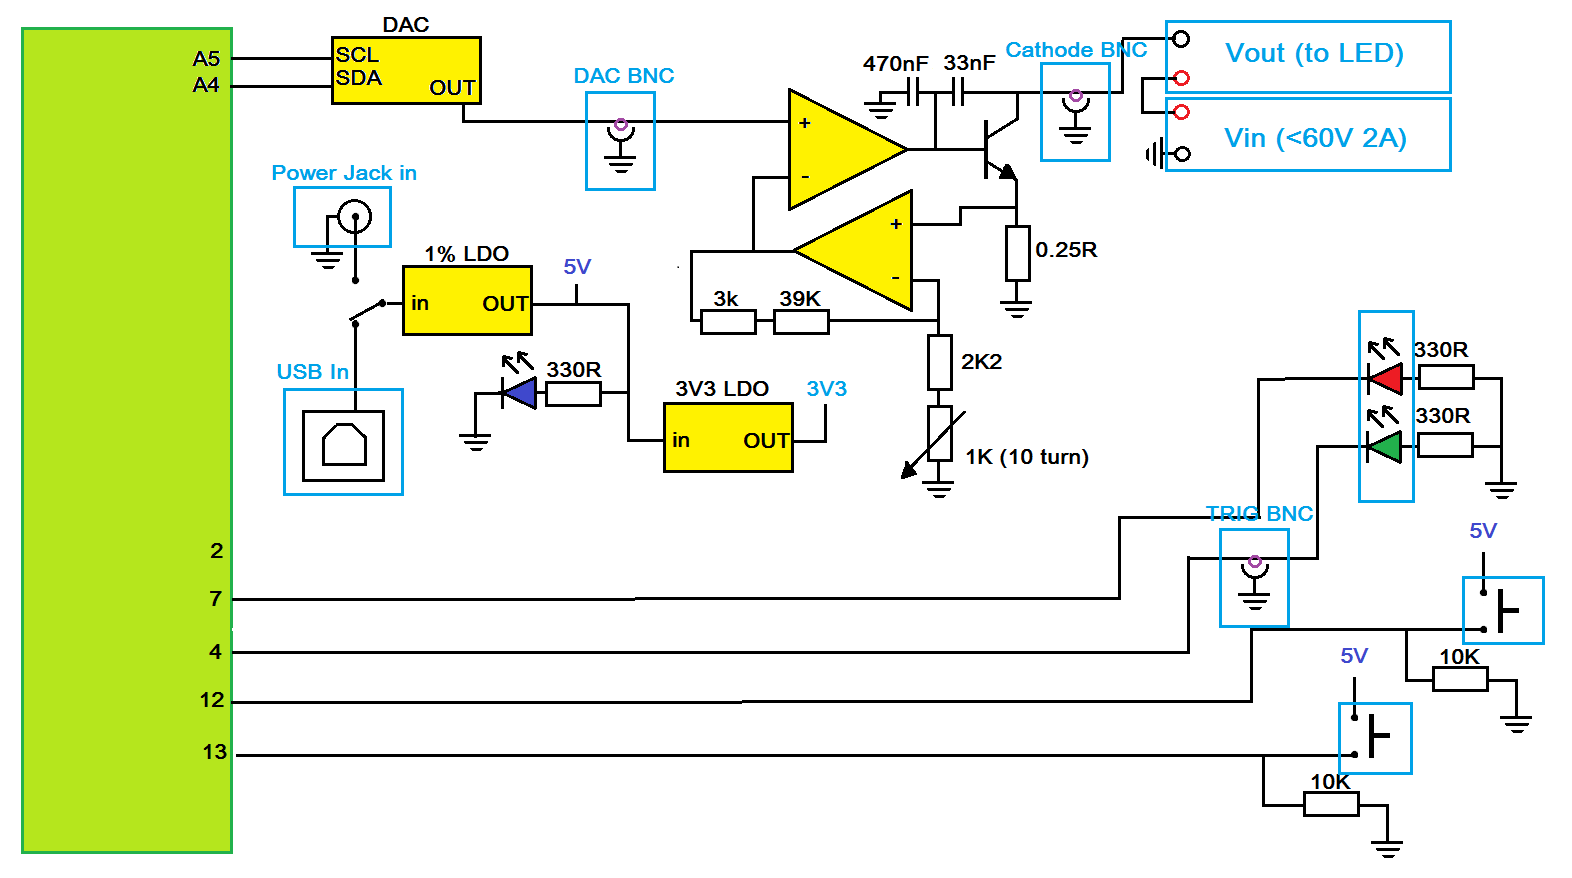
FLED internals diagram by Richard Marshall
A Tektronix MSO4104 Oscilloscope was used to record the P.D. across the LED (and, hence, the junction temperature). The scope has the ability to dump the contents of the screen to a CSV file, and also to trigger data collection based on the output of the FLED box’s DAC, both of which proved very useful to the process of collecting and analysing data.
Experiment design
The Temperature Points
Sharp mostly gives data to customers in terms of `case temperature’, the temperature of a little black spot on top of the device, next to the light-emitting surface (LES). For example, we give them a case temperature that they must not exceed. However, the case temperature is not hugely helpful on its own, because it’s on the part of the LED that’s least likely to fail, and normally stays the coolest.
In addition to the junction, there are several other parts of the LED which have their own operating limits. For this reason, we undertook to work out not only the temperatures of these points, but also the relationship between them.
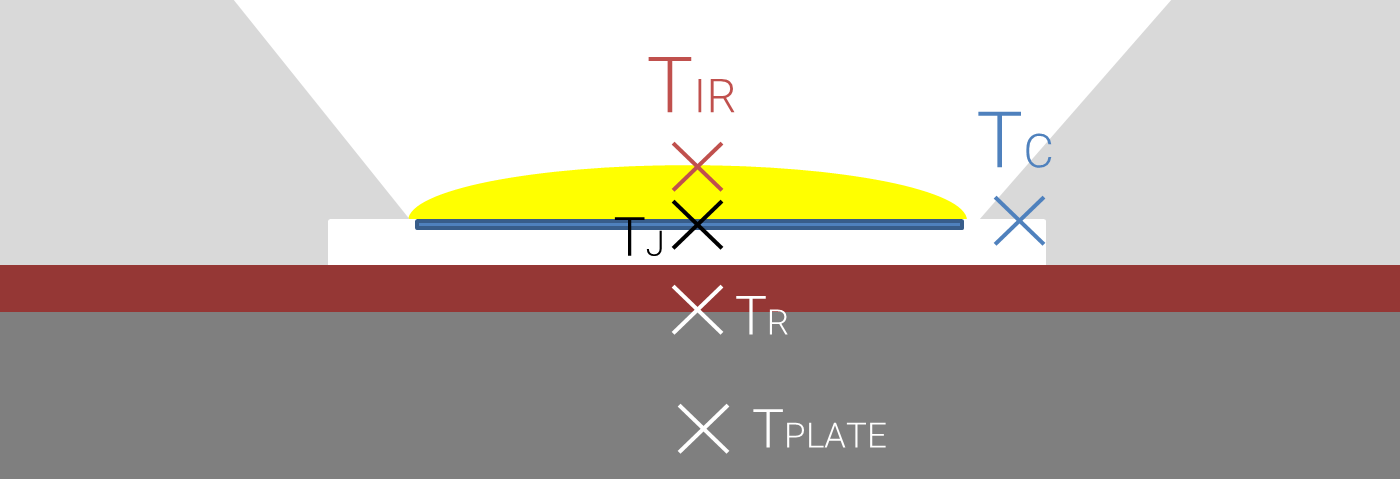
Temperature points for a chip-on-board LED device. Layers from top to bottom: phosphor, die, case, TIM
The phosphor temperature, which we will call T_IR, is the point that gets the hottest, and is therefore the most liable to fail. Most of the failure samples I received had dry or cracked resin in some form. The phosphor layer is significantly less efficient than the LEDs themselves, and to make matters worse, it can’t be put directly into contact with any kind of heatsink. It would be meaningless to talk to customers about this, however, because measuring the temperature and uniformity of the phosphor layer requires a high-end infrared camera. \footnote{Infrared cameras don’t come cheap, and apparently, the military keeps a close eye on the more expensive ones.}
The other important point is T_r. Zhaga (the standards consortium that came up with this metric) define T_r roughly as ‘the temperature at the rear of the LED substrate‘. This means that the T_r point is actually inside the thermal interface material (TIM) that we use between the substrate and adapter plate. Unfortunately, Zhaga are vague when it comes to suggesting actual ways to measure this point – any attempt is going to result in some disruption to the TIM and thermal interface in general, which will worsen the performance of the device! My predecessor had the idea of milling a groove into top of the adapter plate and running a thin thermocouple through it, however, I quickly discovered our phase-change TIM would run into the gap when it became a liquid, and create air bubbles between the LED substrate and heatsink (ouch!). Later, the groove was flipped onto the other side, of the plate, and the thermocouple head was poked through a very small hole at the top.
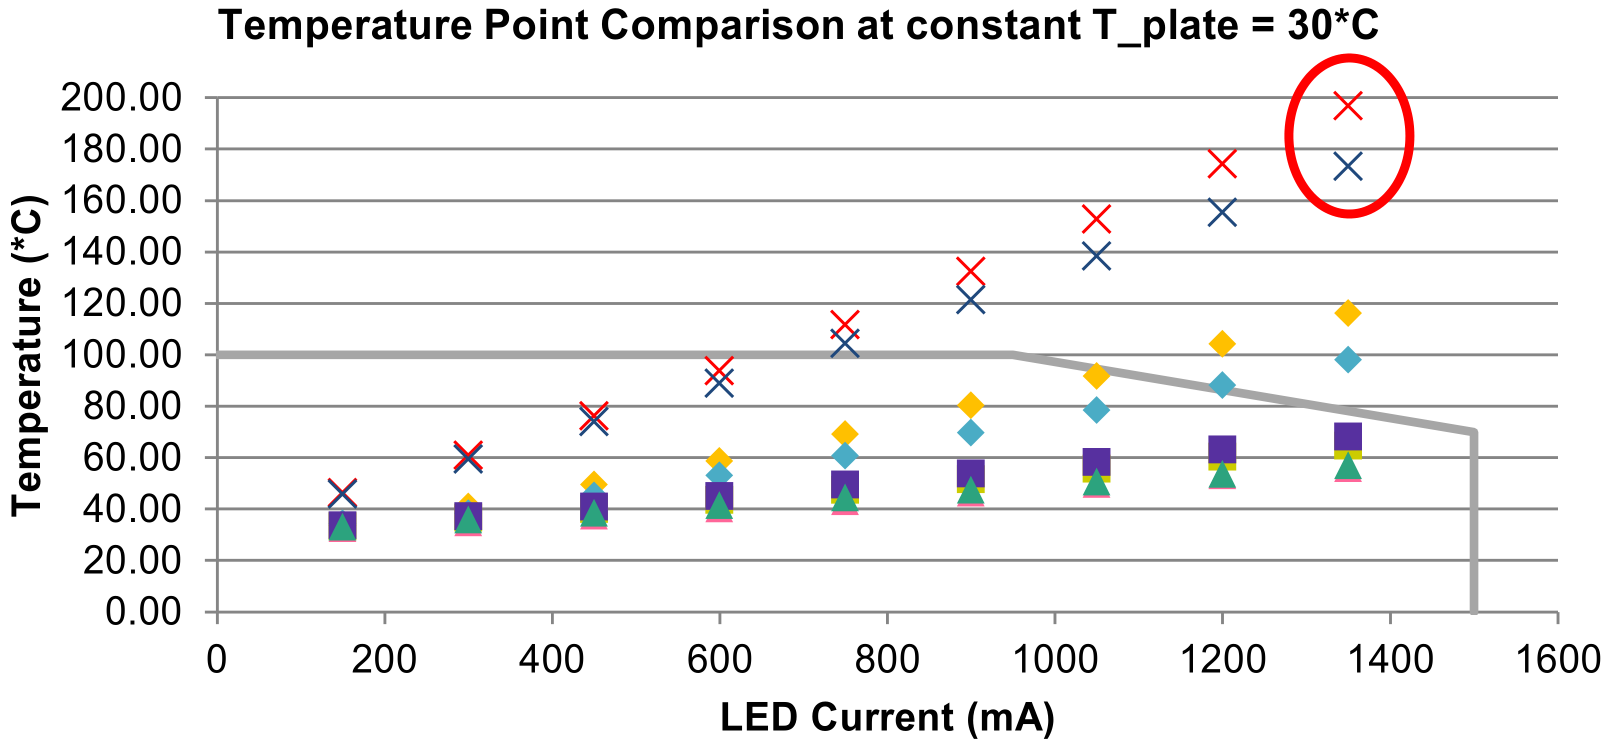
Results
Data collection takes a while, but you can get a full thermal characterisation of any LED – you know how hot all the temperature points are with any current and with any cooling power. You can easily spot issues with thermal integration. You can see the thermal resistance between any two temperature points at a glance. You can compare the efficiency of different devices, with different die layouts or different thermal interface materials, and easily see which one is performing better. You can also see whether the data you’ve acquired is in line with the specification for the LED. In some edge cases (for example, certain types of thermal integration), this might not be correct, which can lead customers to drive their LEDs too hard or cool them insufficiently.
I ended up running tests quite compulsively. I tested Sharp’s new `intermo’ module lineup, and also a range of thermal interface materials I’ve also used these methods to help customers troubleshoot issues their thermal integration, and have written an extensive whitepaper on LED cooling and temperature measurement.
Example data: stagelight company was experiencing LED failure due to overheating. We found evidence that their TIM was being applied incorrectly, and had unusual and inconsistent properties, resulting in non-uniform cooling of the LED.
Last updated December 20, 2016.